

Key concepts
| Term | What it means |
|---|---|
| Benchmark | A question you want tracked, written the way a real person would ask it, for example, “Is Patagonia worth the price?” Each benchmark is run against every model, every day. |
| Answer | One model’s response to one benchmark on one day. Each answer is stored as a mention in your workspace. |
| Model providers | ChatGPT, Claude, Gemini, Grok, and Perplexity. |
| Smart category | The AI classifier that scores each answer. Every AI Perceptions workspace ships with Favorability by default; you can then add your own. |
| Citation | A source URL a model returned while researching its answer. Citations are captured exactly as the provider reported them. |
| Score | A 0-100 roll-up of a smart category across the answers in view, shown with its change over the period. |
AI Perceptions builds on Smart Categories. If you’re new to how PeakMetrics classifies content with AI, start there.
How it works
1
You define the benchmarks
You write the questions you care about. These are the questions your customers, candidates, investors, and employees are actually typing into AI tools. You can also leverage our trending questions tool to see top questions being asked matching your priority keywords.
2
Five models answer them nightly
A job runs at midnight UTC and puts every active benchmark to ChatGPT, Claude, Gemini, Grok, and Perplexity. Each model runs live web searches, so answers reflect what’s on the internet that day, not a frozen training snapshot.
3
Every answer is scored
Your smart categories independently classify each answer. Favorability sorts answers into Favorable, Neutral, Unfavorable, or Unrelated.
4
Citations are captured
Every source URL a model used is stored alongside the answer, so you can see which domains and which specific pages are shaping what models say.
5
You analyze it in the workspace
The Dashboard tab gives you the 30-day picture. The Benchmarks tab lets you go question by question, model by model, day by day.
AI answers are a channel, not a silo
Under the hood, every AI Perceptions workspace is backed by a custom channel named{Workspace Name} (AI Perceptions). That means AI answers behave like any other mention source: you can pull them into a regular topic workspace and view them next to news and social posts.
A comms team can see a story break in the press, watch it get picked up on Reddit, and then watch it surface in AI answers about the brand a few days later, all in one view, instead of treating AI as a separate report nobody reads.
Setting up a workspace
Create an AI Perceptions workspace through the guided setup wizard. The wizard provisions the linked custom channel and a default Favorability smart category for you.Writing good benchmarks
Benchmark quality determines whether this tool tells you anything useful. A few principles:Ask what real people ask
Ask what real people ask
Write questions in natural language, not brand-approved language. “Does Patagonia use sweatshops?” is a real question people ask AI tools. “What is Patagonia’s supply chain governance framework?” is not.
Cover the questions you're afraid of
Cover the questions you're afraid of
The highest-value benchmarks are usually the uncomfortable ones: controversies, pricing objections, ethical claims, layoffs, competitor comparisons. These are where models are most likely to reach for third-party sources you don’t control, and where an unfavorable answer costs you the most.
Mix categories
Mix categories
Balance reputation questions (“Is Patagonia actually sustainable or just good marketing?”) with product and consideration questions (“What’s the best Patagonia rain jacket for hiking?”) and competitive ones (“Is Patagonia better than Arc’teryx?”). Product questions tend to score well and give you a stable baseline; reputation questions are where movement happens.
Keep each question single-barreled
Keep each question single-barreled
One question per benchmark. Compound questions produce answers that are hard to score consistently and harder to act on.
Set them and leave them
Set them and leave them
Benchmarks are most valuable as a time series. Resist rewording a question mid-flight, you’ll break the trend. Add a new benchmark instead.
Custom smart categories
Favorability answers “is this good or bad for us?”, but you can add smart categories that answer whatever question matters to your team. Common additions:- Accuracy: is the model’s answer factually correct about us?
- Recency: is the model citing current information, or repeating something from three years ago?
- Competitor framing: does the answer position us favorably against a named competitor?
- Message pull-through: does the answer contain the language from our current campaign?
The Dashboard tab
The Dashboard summarizes the trailing 30 days across all benchmarks and all models.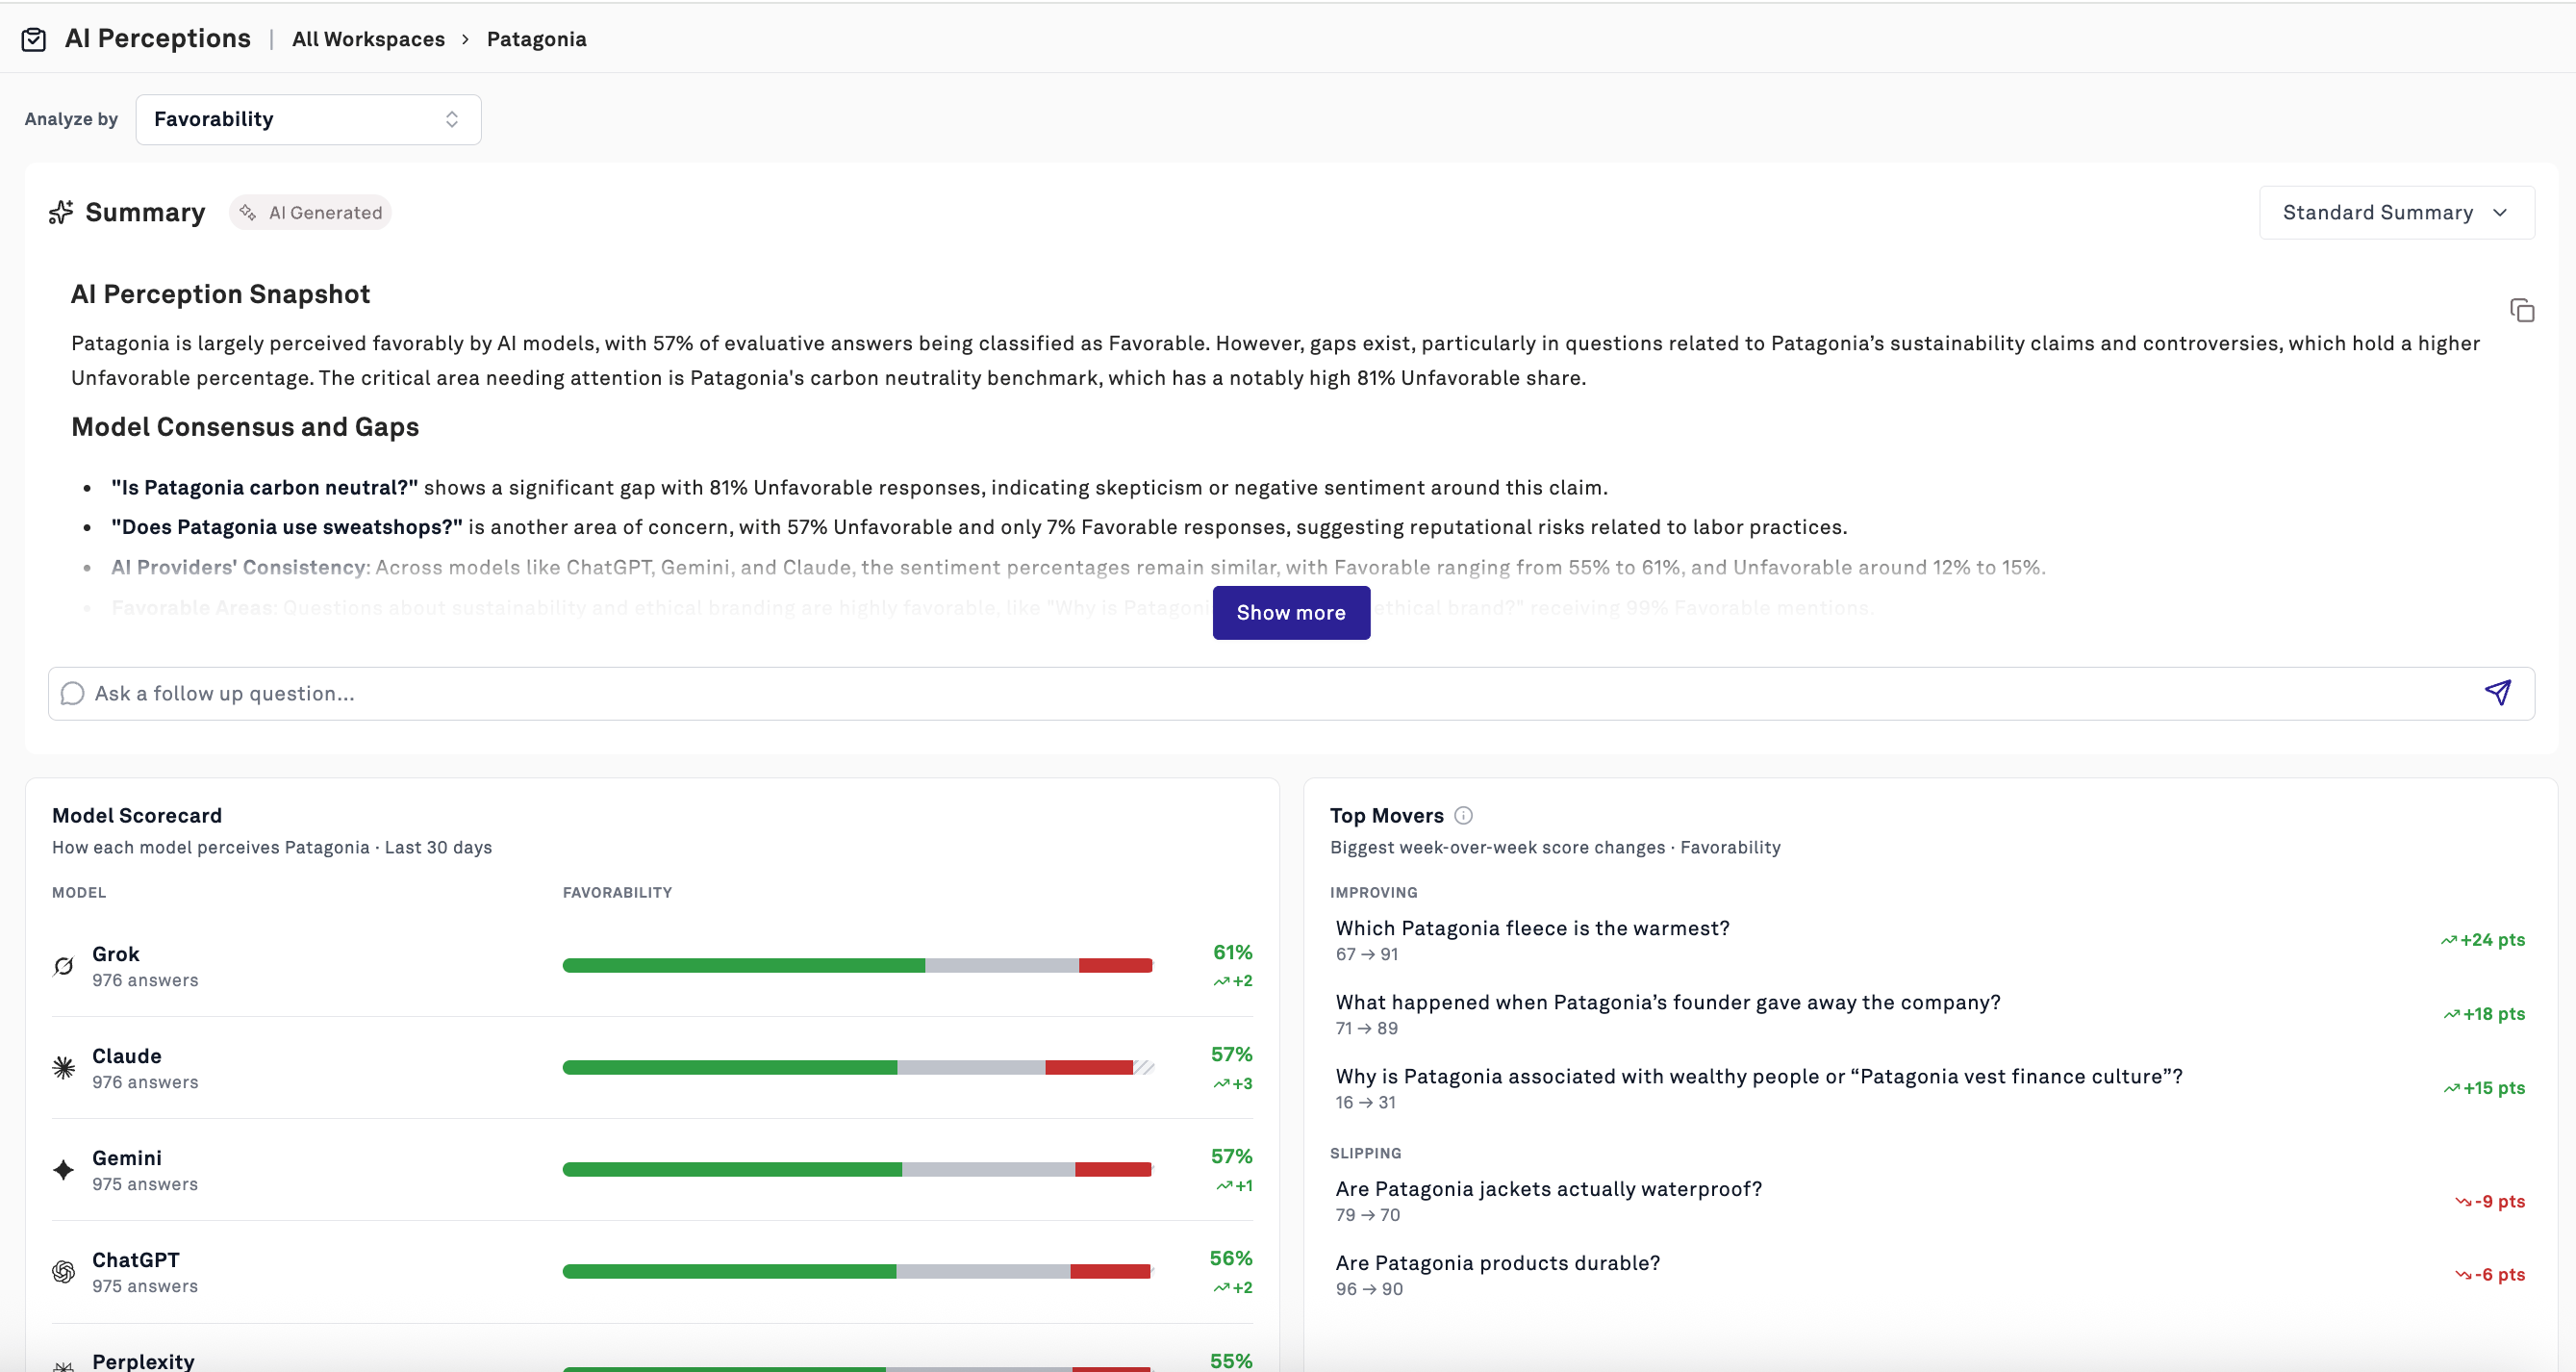
AI Perception Snapshot
An AI-generated summary at the top of the page that identifies where the models agree, where they diverge, and which benchmarks are dragging your score down. It calls out consensus (“‘Are Patagonia products durable?’ — high consensus with a 91% Favorable score”) and gaps (“‘Does Patagonia use sweatshops?’ — a significant divide; 48% of responses are Unfavorable”). Use the Ask a follow up question box to interrogate the summary directly, and the summary-type selector to switch between summary formats. See Custom AI-Generated Summaries for how summary types work.Model Scorecard
How each model perceives you, over the last 30 days, with each model’s answer count and point change. Models disagree more than people expect: a 62% on Grok next to a 58% on Gemini is a normal spread, and a much wider gap is a signal worth investigating.Top Movers
The biggest week-over-week score changes, split into Improving and Slipping. This is your early-warning widget. A benchmark that drops 20 points in a week usually means a new article got published and the models found it.Top Questions
Your benchmarks ranked by share of answers in a given sentiment. Set View by to Unfavorable and you have a prioritized list of your problems, the questions where models most consistently say something bad about you.Top Cited Domains
The domains models lean on most when answering questions about you, ranked by citation count. Expect to see your own site, Reddit, YouTube, trade publications, and review sites. The relative order tells you a lot: if a single forum thread or review site outranks your own domain, that source is effectively writing your brand’s AI answers.Smart category breakdown
A donut showing the distribution of all answers across your selected smart category, with the total answer count for the period.The Benchmarks tab
Every tracked benchmark as a row, with a day-by-day heatmap of the last 30 days and its 7-day score change. Color by switches the heatmap to any of your smart categories.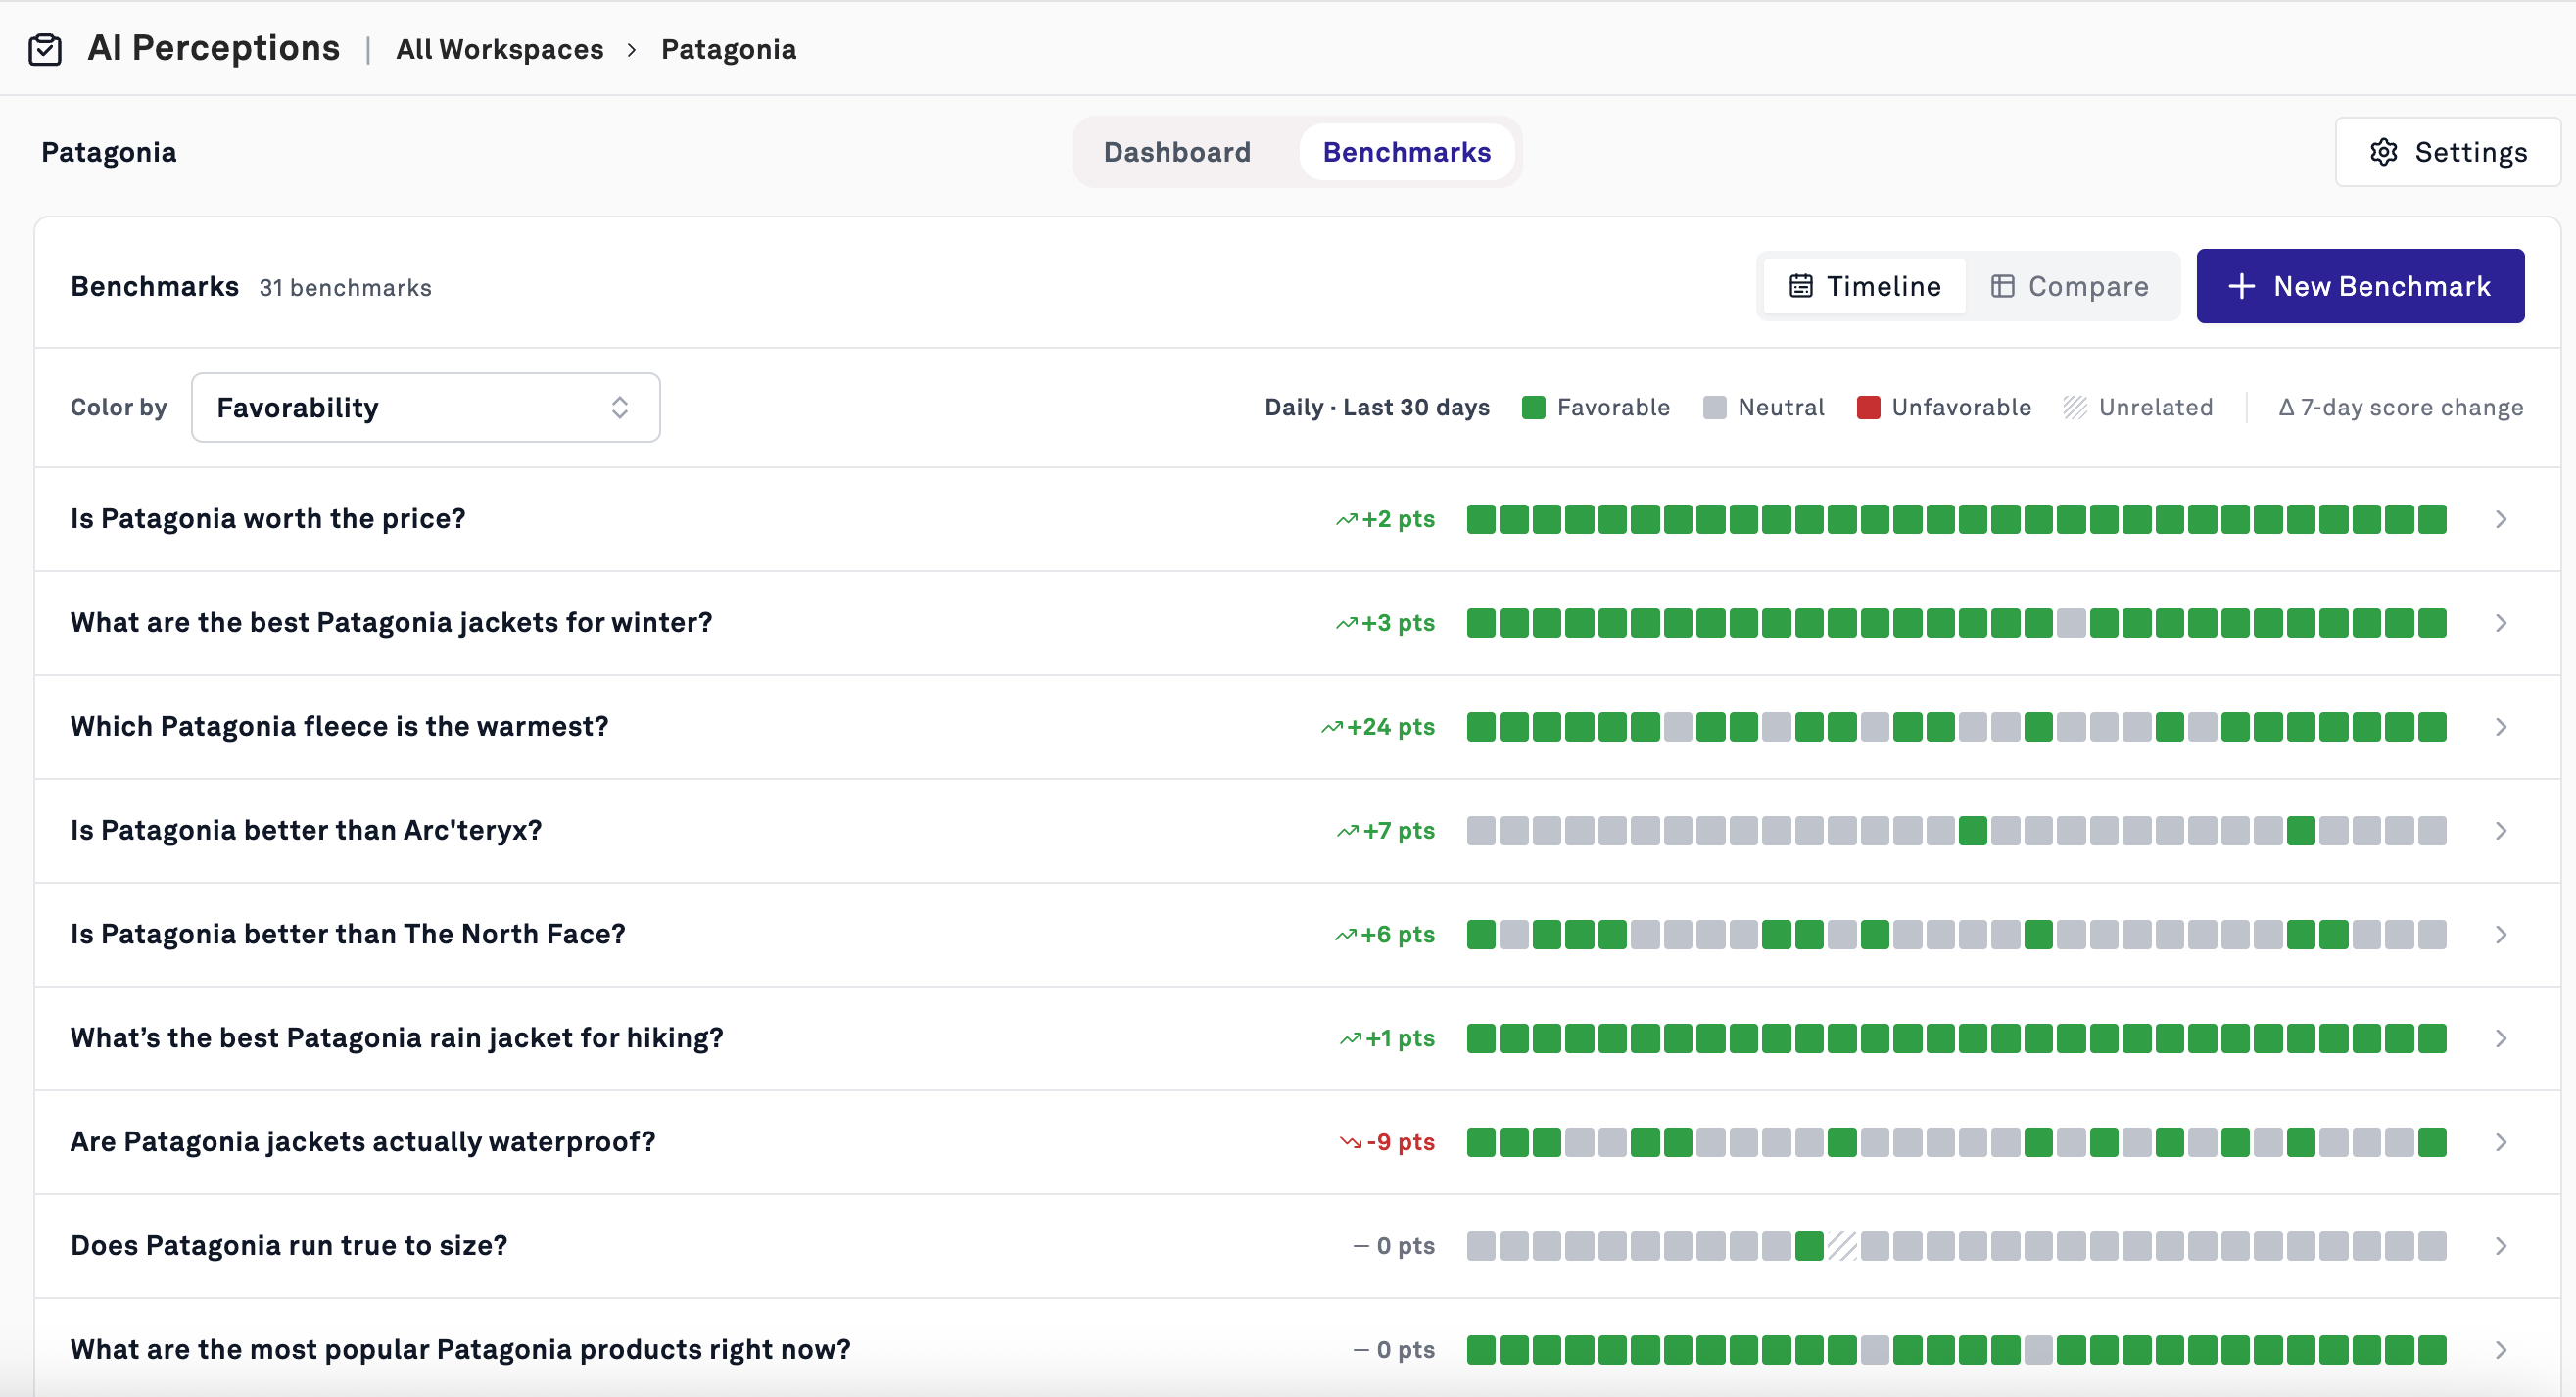
- Solid green: stable and safe. “What’s the best Patagonia rain jacket for hiking?” at 0 points of change means the models have settled.
- Mostly grey: models are hedging or answering non-committally. Common on comparison questions (“Is Patagonia better than The North Face?”), where models often refuse to pick a winner. Grey isn’t bad, but it’s a missed opportunity: no one is making your case.
- Speckled red: contested. Something in the source pool is producing unfavorable answers intermittently.
- A clean color break mid-timeline: an event. Something changed on a specific date. Open the cells on either side of the break to find out what.
Inside a benchmark
Click any benchmark to open its detail view. Change Over Time breaks the heatmap out into one row per model, so you can see which provider is the outlier on this specific question. Cells marked Not run indicate the benchmark wasn’t active that day. Click any individual cell to read that model’s full answer for that day, rendered with its original formatting, links, and tables. Citations shows every source behind this one question: total citation count, domain count, and a ranked list you can view by domain or by page, each with its own favorability breakdown. This is the view that turns a bad score into an action item. If “Does Patagonia use sweatshops?” is 51% Unfavorable, the Citations tab names the specific pages producing that answer.Citation deep-dive
Click any domain in Top Cited Domains to open its deep-dive. Each domain is classified as owned, community, video, or third-party, and reported with:- Citations (30 days) and the change over the period
- Share of citations: what percentage of all citations about you come from this one domain
- Answers favorable: how favorable the answers citing this domain tend to be
- Citations over time: daily trend
- Top cited pages: the specific URLs models are pulling from, each with its own favorability bar
This is the most actionable screen in the product. When one of your own pages is cited 367 times and shows meaningful unfavorable share, you’ve found a page that is actively working against you in AI answers, and you can edit it today.
What to do with it
Fix your own pages first
Fix your own pages first
Owned-source citations are the only ones you fully control. Sort your top cited pages by citation volume, look at their favorability, and rewrite the ones that are both heavily cited and unfavorable. Ambiguous, hedged, or outdated language on your own site gets read back to prospects as doubt.
Target the third-party sources doing the damage
Target the third-party sources doing the damage
When a specific outlet or forum thread drives a persistent unfavorable answer, that’s a media relations target with a measurable outcome attached. Instead of “we should get better coverage,” you have “this page is cited 126 times and feeds four of our worst-scoring benchmarks.”
Fill the silence on grey benchmarks
Fill the silence on grey benchmarks
Benchmarks that score mostly Neutral usually mean the models couldn’t find authoritative material. That’s a content gap, and typically easier to fix than reversing a negative narrative.
Measure whether a placement worked
Measure whether a placement worked
Publish a piece, then watch the benchmarks it should affect. If citations to the new source appear and the score moves, you have attribution for a comms action, which is rare.
Brief your executives on what AI says about them
Brief your executives on what AI says about them
Model answers are increasingly what candidates, partners, and journalists see first. A monthly readout of the Model Scorecard and Top Unfavorable Questions is a fast, concrete leadership update.
FAQs
Why do the models disagree with each other?
Why do the models disagree with each other?
Each provider uses a different underlying model, a different web search tool, and different rules about which sources to trust and how to hedge. Disagreement is expected and is itself useful information: it tells you where the source pool is thin or contested enough that different research paths produce different conclusions.
Why did a score change when nothing happened on our end?
Why did a score change when nothing happened on our end?
Models search the live web. A new article, a Reddit thread gaining traction, or a competitor’s press release can shift answers without any action from you. Check the Citations tab for the affected benchmark to see whether a new source entered the mix.
Will I get the same answer if I ask ChatGPT myself?
Will I get the same answer if I ask ChatGPT myself?
Not necessarily. Model answers vary between runs, and your personal ChatGPT session carries different context. That variability is exactly why daily tracking across five providers is more reliable than spot-checking: you’re reading a trend, not a single response.
How soon after adding a benchmark will I see data?
How soon after adding a benchmark will I see data?
Your first answers arrive after the next nightly collection at midnight UTC. Allow a couple of weeks before reading trends into a new benchmark.
What does 'Not run' mean in a heatmap?
What does 'Not run' mean in a heatmap?
The benchmark wasn’t active for that day, so no answer was collected. This is normal for benchmarks added partway through a period.
Related reading
Smart Categories
How AI classification scores every answer in your workspace.
Smart Categories Workflow Guide
Building custom categories beyond Favorability.
Getting Started with Workspaces
How workspaces, mentions, and channels fit together.
Custom AI-Generated Summaries
Tailoring the summary at the top of your dashboard.