

Landscapes is in Beta and available to select customers. Features and behavior may change. If you’d like access, contact your Customer Experience Manager or support@peakmetrics.com.
Key concepts
Theme
Theme
A broad, durable area of conversation that defines part of the topic’s landscape, for example, FIFA Governance Crisis and Infantino’s Leadership or Brand Activation and Tournament-Driven Commerce. Themes are meant to persist across the whole time window rather than spike and vanish. A typical Landscape produces around 10-15 themes.
Storyline
Storyline
A specific, shorter-lived conversation, event, or story inside a theme, for example, Luis Figo and former players call for resignation and FIFA reform or Prediction-market activity around the World Cup 2026. Storylines are where the volume actually comes from. Each storyline belongs to exactly one theme; there’s no overlap between themes.
How a Landscape is built
1
A representative sample is drawn
The platform pulls a statistically significant sample of mentions from your workspace. Sampling, rather than reading volume top-down, keeps themes reflective of the actual distribution of conversation, so a single viral spike doesn’t hijack the taxonomy.
2
Themes are generated
An AI agent identifies the broad themes present in the sample. If you’ve supplied context, it shapes this step.
3
Mentions are classified into themes
Each mention is assigned to its closest theme, or to Not Applicable.
4
Storylines are generated per theme
For each theme, a fresh sample is drawn from only that theme’s mentions, and storylines are generated from it. This scoping is what guarantees each storyline belongs to one theme and one theme only.
5
Mentions are classified into storylines
Within each theme, mentions are matched to that theme’s storylines, or to Not Applicable.
Generation takes time to run across a large workspace. A Landscape is a snapshot of the window it was built over, it does not reclassify new mentions automatically.
Exploring your Landscape
The Landscape tab
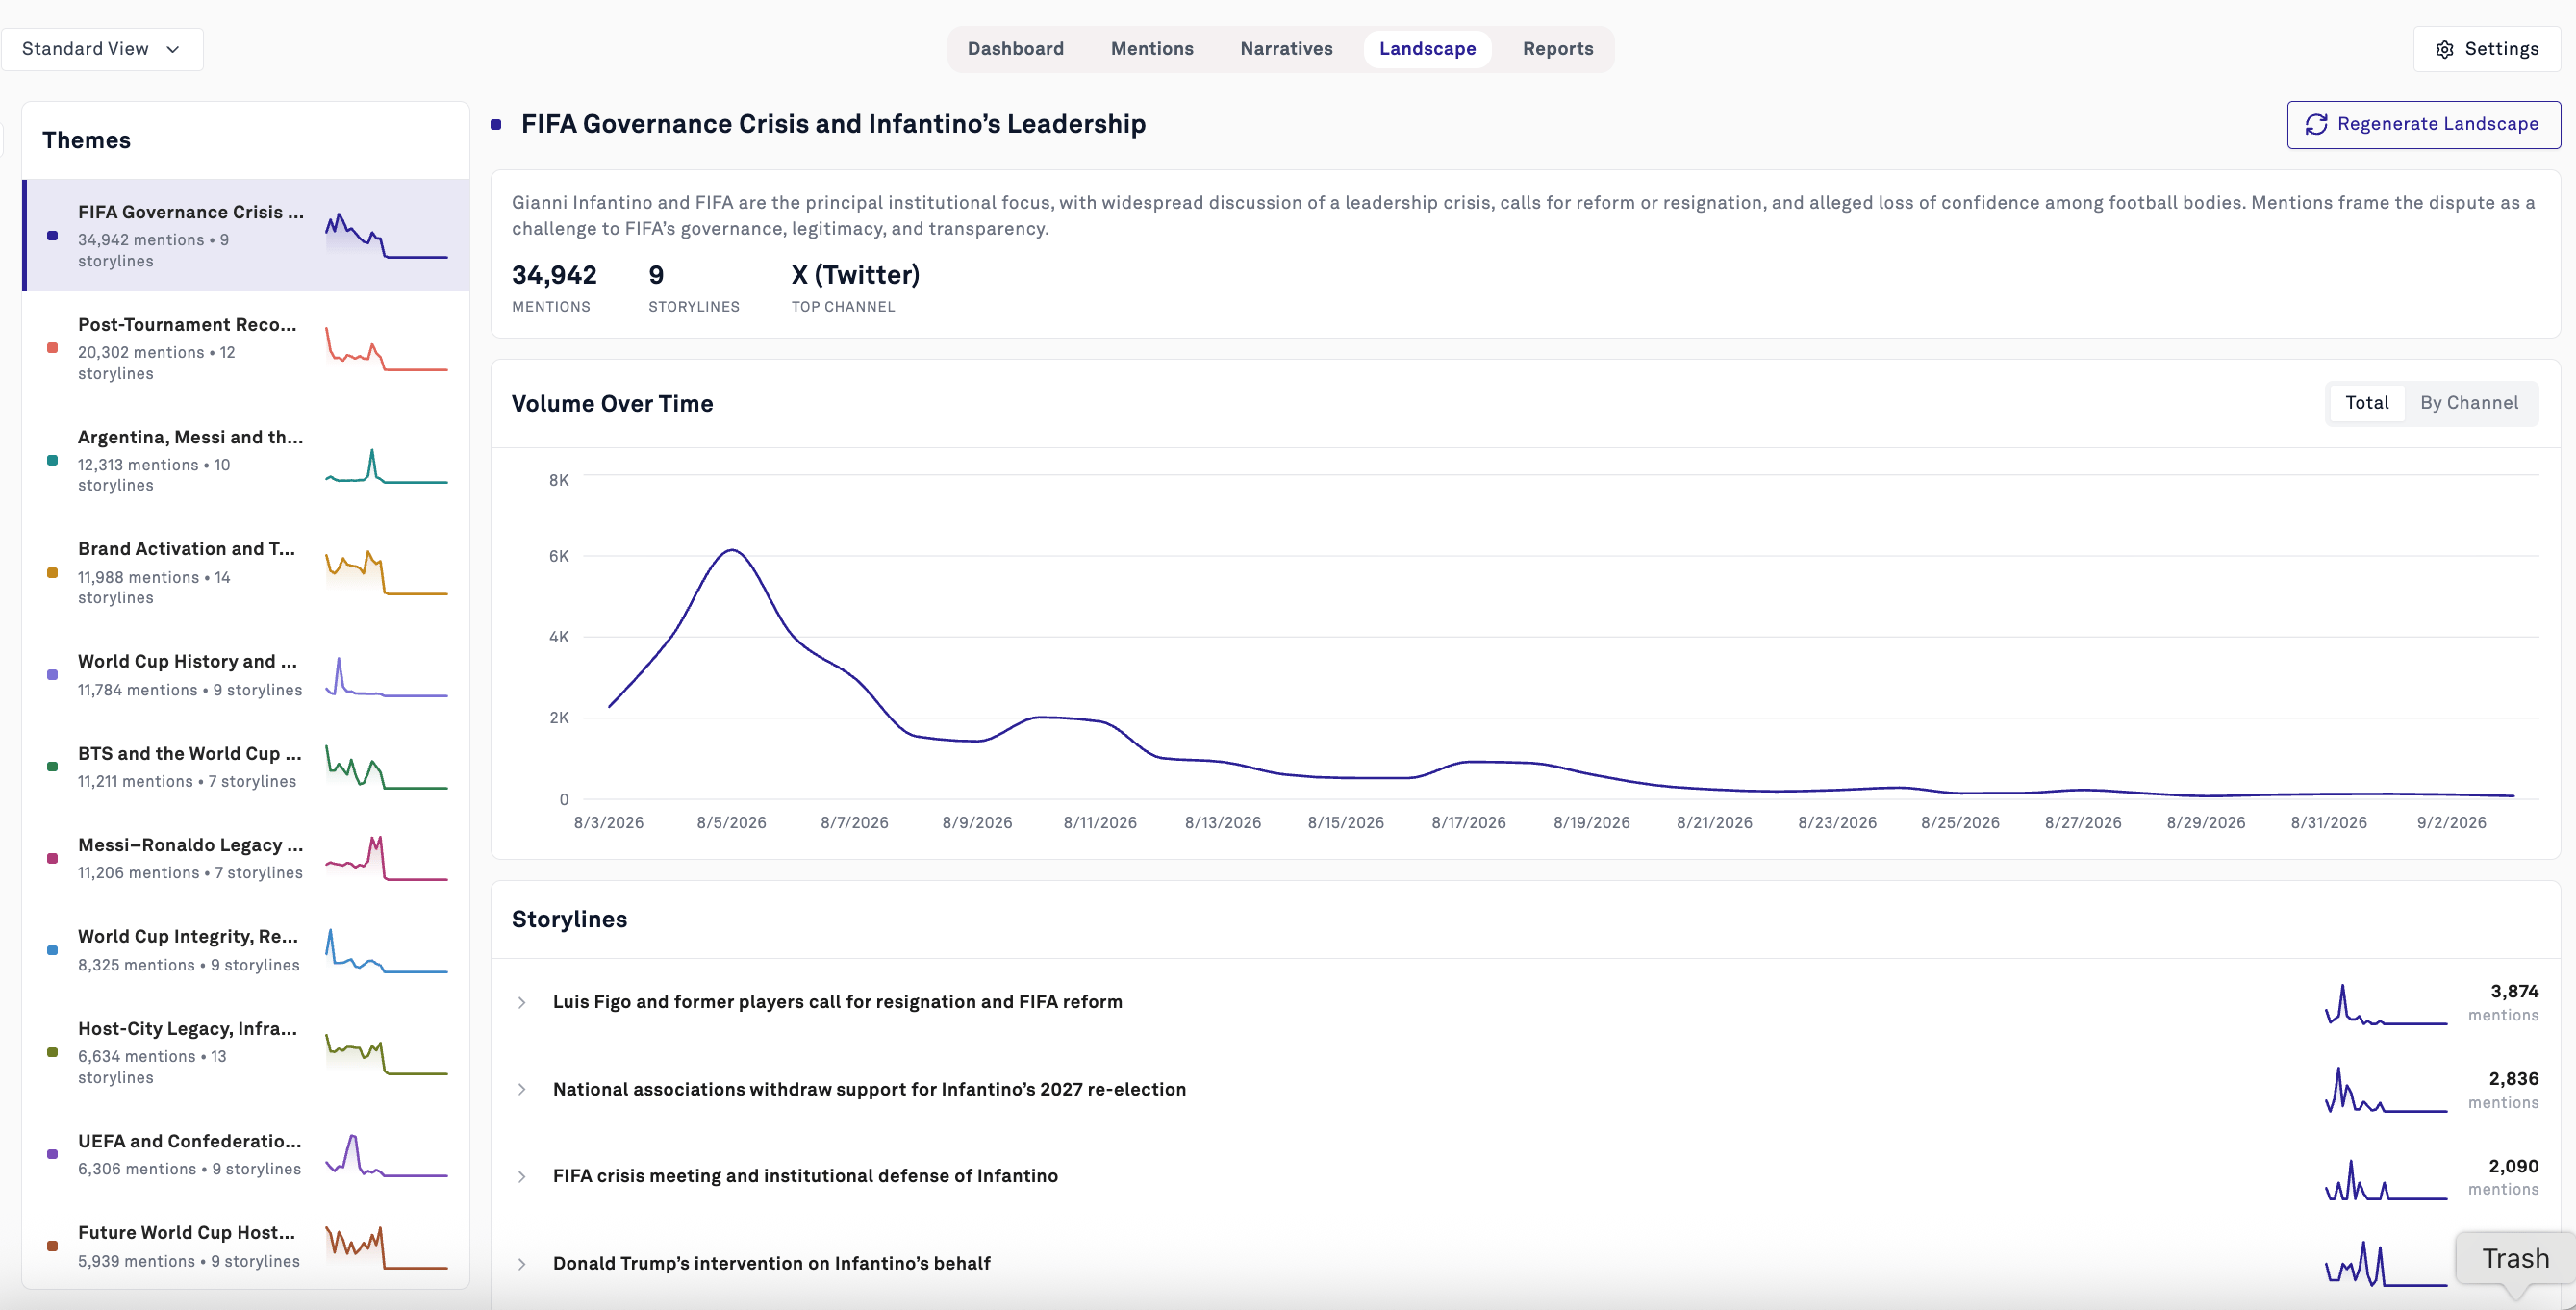
Open the Landscape tab in your workspace. The left rail lists every theme with its mention count, storyline count, and a graph of its volume over the period. This is your fastest read on shape. Selecting a theme opens its detail view:- A description of what the theme covers and how mentions frame it
- Headline stats, total mentions, storyline count, and top channel
- Volume Over Time, with a Total / By Channel toggle
- Storylines, ranked by mention volume, each expandable with its own line graph
Dashboard integration
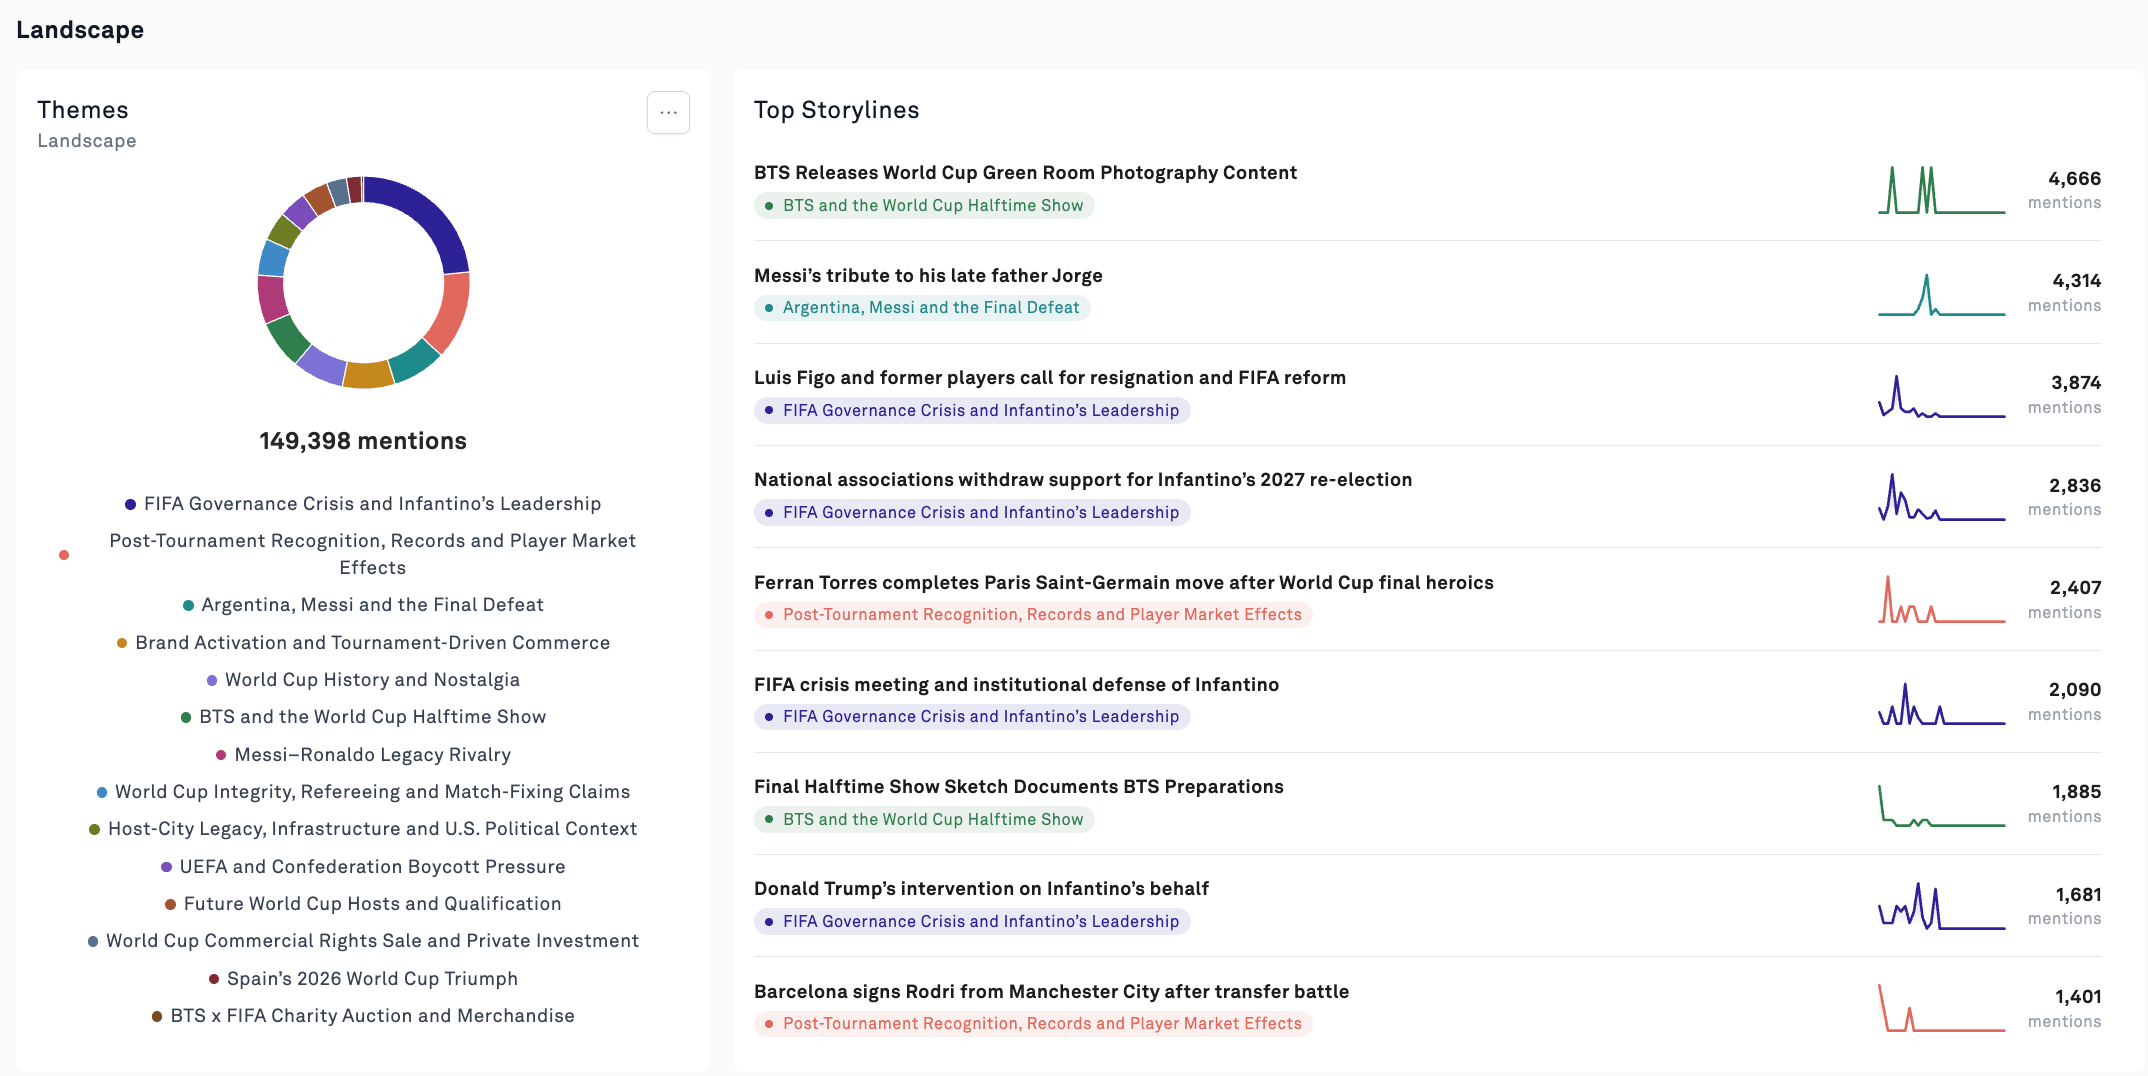
Your dashboard shows a Themes donut with the distribution of mentions across the landscape, alongside a Top Storylines list ranked by volume with each storyline tagged by its parent theme. Themes and storylines also work as filters, so you can drill progressively: filter to a theme, pick a storyline, and land on the individual mentions behind it. Everything else in the workspace (filters, exports, reports) works on that filtered set.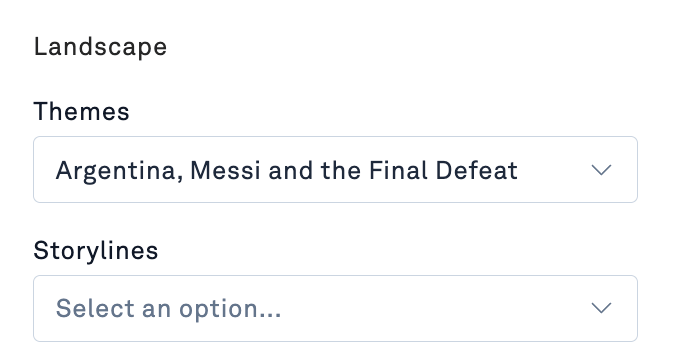
Network graph
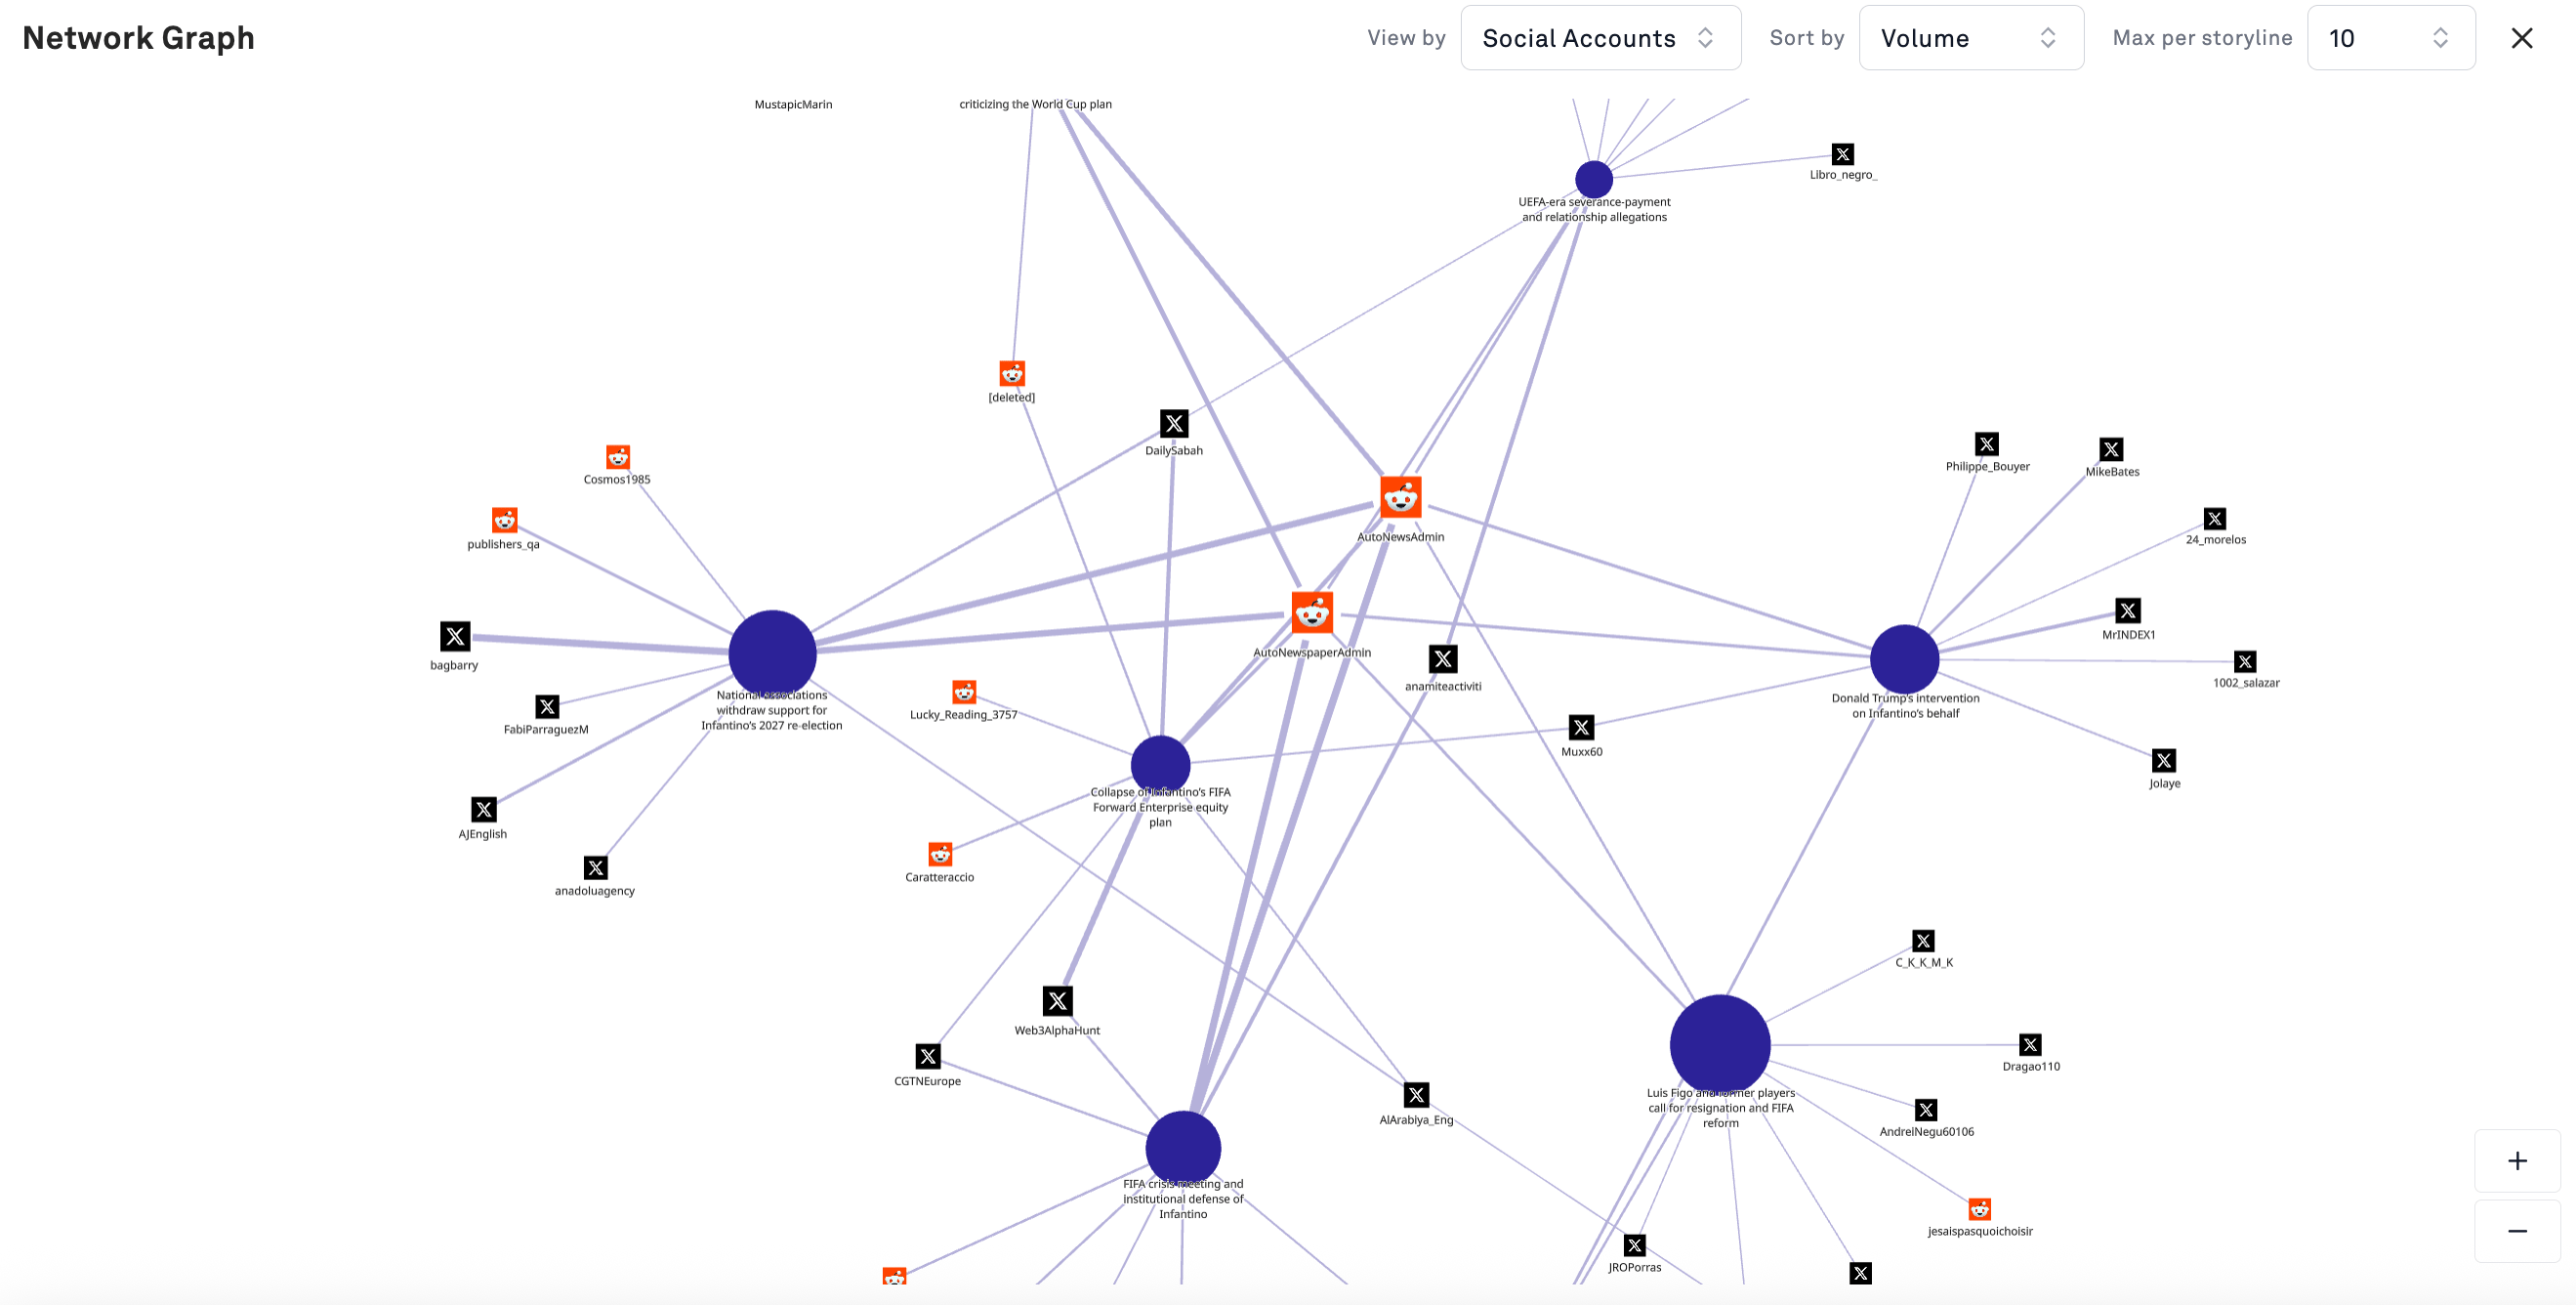
From a theme’s storylines you can open a network graph showing the top social accounts posting about each storyline. Storylines appear as large nodes; accounts connect to the storylines they post about, with edge weight reflecting volume. Controls let you set View by, Sort by (e.g. volume), and Max per storyline to keep dense graphs readable. What to look for:- Accounts connected to several storylines at once. A single account amplifying four separate storylines inside a theme is doing more work than its individual post counts suggest.
- Tight clusters around one storyline. Concentrated amplification from a small account set may indicate coordination, or simply an engaged community. The graph surfaces the pattern; you still have to check the accounts.
- Which platforms dominate a storyline’s node cluster. Storyline reach that is entirely Reddit reads very differently than one carried by news-affiliated accounts on X.
Regenerating a Landscape
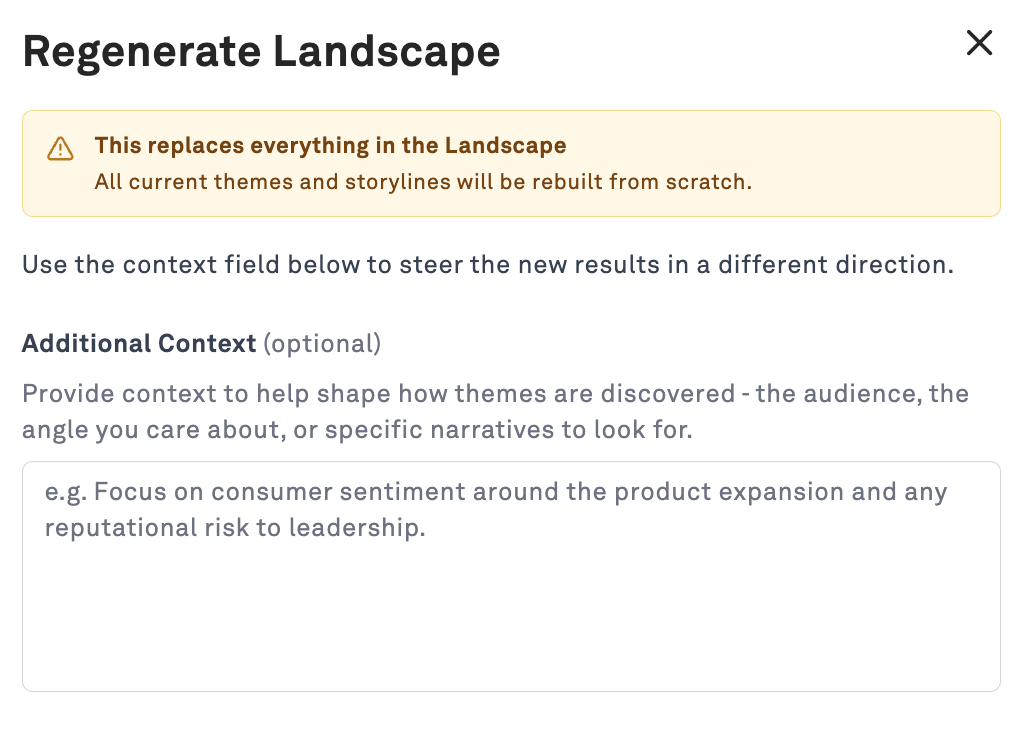
Regenerate Landscape rebuilds the entire taxonomy from scratch. Regenerate when:- The conversation has materially moved on and your themes no longer describe it
- A major event has occurred that the existing taxonomy has no home for
- The first pass came back too generic, too fragmented, or aimed at the wrong angle
Steering with Additional Context
The regenerate dialog includes an optional Additional Context field that shapes how themes are discovered. Use it, an unguided regeneration will usually produce a taxonomy similar to the one you’re replacing. Useful things to provide:- The angle you care about. “Focus on reputational risk to leadership rather than sporting outcomes.”
- Who the output is for. “This supports a policy brief for senior government stakeholders.”
- Candidate themes you already suspect. Naming two or three you expect gives the agent an anchor.
- Situational background. Context the model can’t infer from mentions alone: an ongoing investigation, a pending decision, a relationship between named actors.
- What to exclude. If commercial or product chatter is drowning out what you need, say so.
Common workflows
Getting up to speed on an unfamiliar topic
Getting up to speed on an unfamiliar topic
Generate a Landscape, read the theme rail top to bottom, then read each theme’s AI description. In about ten minutes you have the shape of a conversation you knew nothing about, including the parts you wouldn’t have thought to search for.
Preparing a briefing
Preparing a briefing
Themes give you your section structure. Storylines give you the specifics and dates underneath each one. The volume-by-channel view gives you trajectory. Because every storyline is filterable, you can pull supporting mentions for any claim on the spot, which is what makes unanticipated questions survivable.
Finding what you weren't looking for
Finding what you weren't looking for
The most useful themes are often the ones nobody on the team had flagged. Scan for themes you didn’t expect and check whether they’re growing.
Tracking escalation
Tracking escalation
Switch a theme to By Channel and watch for conversations crossing from social into news, or spreading across multiple platforms. That crossover is your escalation signal.
Identifying amplifiers
Identifying amplifiers
Use the network graph to find accounts driving multiple storylines, then investigate those accounts directly in the Mentions tab.
FAQs
Does a Landscape update automatically?
Does a Landscape update automatically?
Not yet. It’s a snapshot of the 90-day window it was generated over. Regenerate to bring it current.
Can a storyline belong to more than one theme?
Can a storyline belong to more than one theme?
No. Storylines are generated inside a single theme, so the relationship is strictly one theme to many storylines.
Why did a mention land in a theme I disagree with?
Why did a mention land in a theme I disagree with?
Classification assigns each mention to its closest match. Ambiguous mentions, especially short social posts touching several subjects, can land in a neighboring theme. If you see this at scale rather than in isolation, the themes are probably drawn too close together.
Can I edit or rename a theme?
Can I edit or rename a theme?
Not in the current Beta. Steer the output using Additional Context and regenerate.
Questions or feedback on the Beta? Reach out to support@peakmetrics.com, Beta feedback directly shapes what ships.