> ## Documentation Index
> Fetch the complete documentation index at: https://docs.peakmetrics.com/llms.txt
> Use this file to discover all available pages before exploring further.
# Smart Categories Custom AI Classification
> Build your own AI classifiers to tag every mention in your workspace against the questions your team actually cares about.
Smart Categories let you define a classification question in plain language, give the AI a set of labels to choose from, and have every mention in your workspace tagged against it, automatically, continuously, and at any scale.
Most monitoring tools give you a fixed set of fields: sentiment, channel, reach. Those answer generic questions. They don't answer *"is this mention a material risk to us or routine noise?"* or *"is this person a policy journalist or a customer?"* or *"does this post show our logo?"* Smart Categories let you add the field you actually need, and then use it everywhere the platform uses any other field: filters, charts, summaries, exports, and reports.
Ready to build one? See [Creating a Smart Category](/help/enrichments-and-integrations/creating-a-smart-category) for the step-by-step setup.
***
Once created, the category is backfilled 90 days across your existing mentions and applied to new mentions as they arrive. That means a category you build today gives you history you can trend immediately, not just data going forward.
### The Not Applicable convention
Most well-built categories include an escape-hatch option like **Not Applicable** for mentions that genuinely don't fit any real label. This matters more than it sounds: without one, the AI is forced to put off-topic content somewhere, and it will quietly distribute it across your real categories, inflating your numbers in ways that are hard to spot later.
***
## Where Smart Categories show up
Once created, a Smart Category behaves like any other workspace field.
### Dashboard widgets
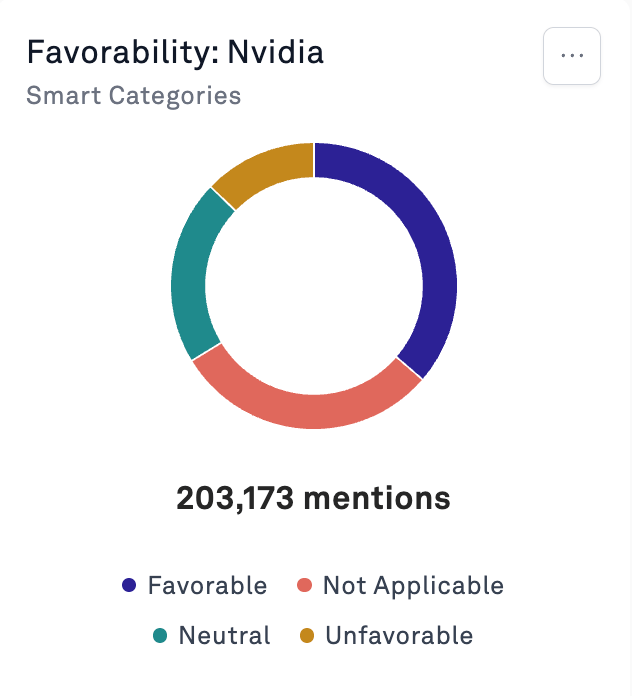
Each category gets its own chart on your workspace dashboard, as a donut or a ranked list with counts and percentages.
 ### Filters
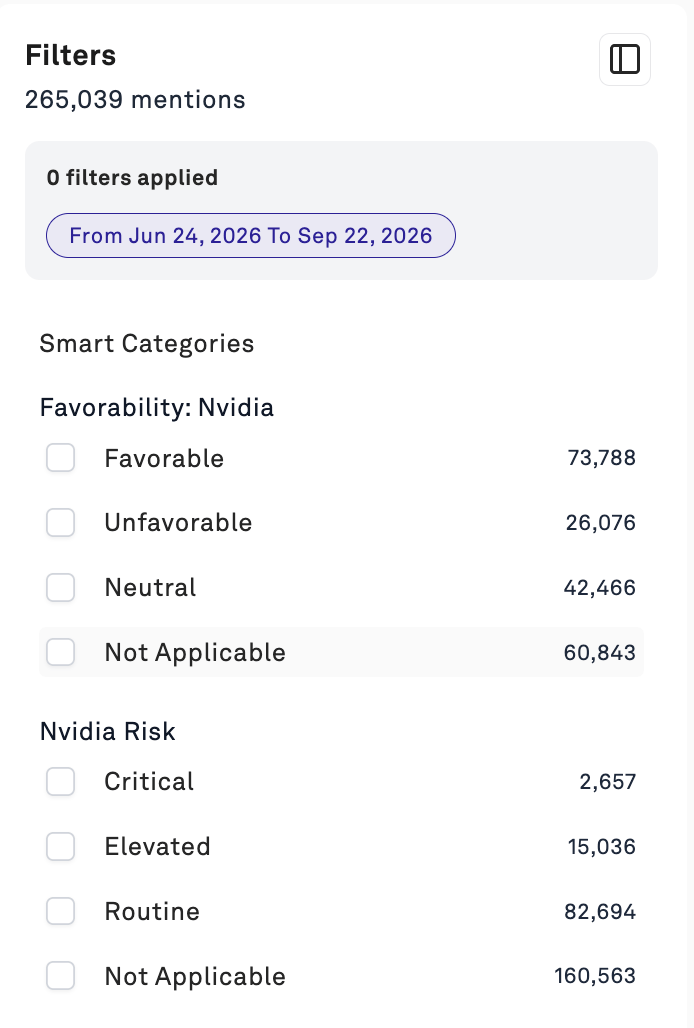
Every category appears in the filter panel with live counts per option, so you can scope the entire workspace to one segment, or combine categories to intersect them. Filtering to `Critical` plus `Unfavorable` gets you a very short, very useful list.
### Filters
Every category appears in the filter panel with live counts per option, so you can scope the entire workspace to one segment, or combine categories to intersect them. Filtering to `Critical` plus `Unfavorable` gets you a very short, very useful list.
 ### Volume Over Time
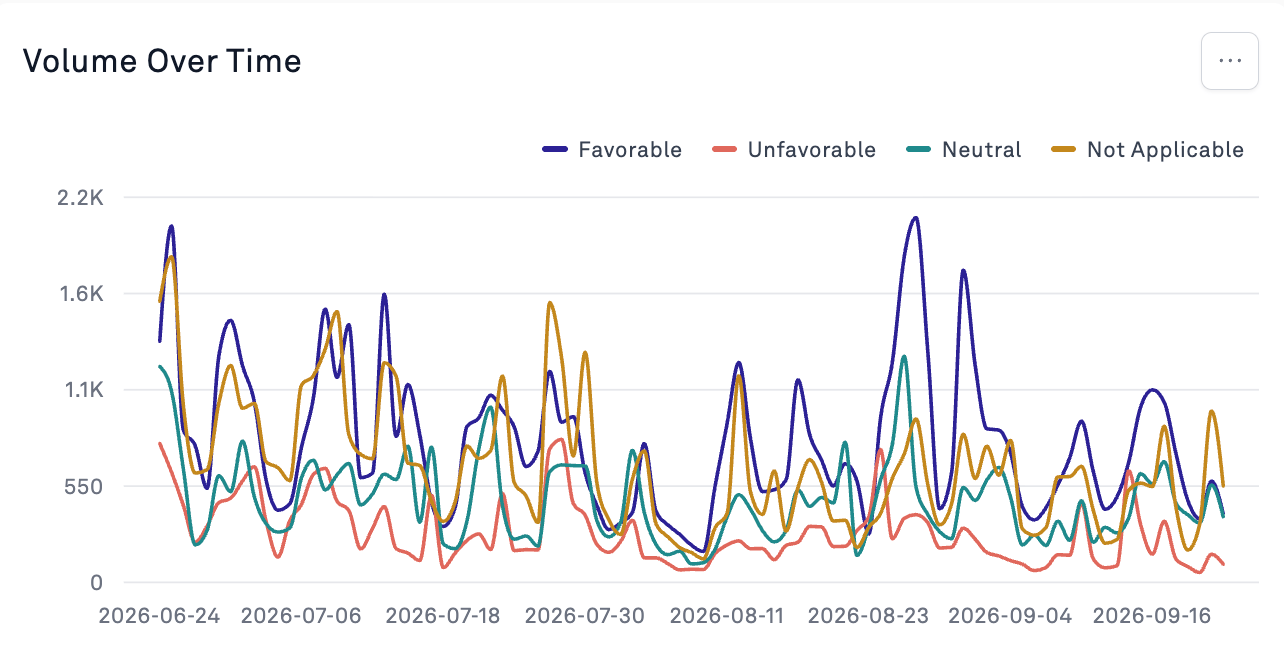
Open the chart's **⋯** menu → **Change Group By Metric** and select a Smart Category to break volume out by your own labels over time.
### Volume Over Time
Open the chart's **⋯** menu → **Change Group By Metric** and select a Smart Category to break volume out by your own labels over time.
 ### Summaries, reports, and exports
Categories feed [AI-generated summaries](/help/building-reports/custom-ai-generated-summaries-in-peakmetrics), so filtering to a category and generating a summary gives you a narrative read of just that segment. Category values also export with your mentions for analysis elsewhere, see [Exporting Data](/help/workflows/exporting-data-from-peakmetrics-unlocking-powerful-insights).
***
## Example use cases
Severity tiers (`Critical`, `Elevated`, `Routine`) so crisis teams work a ranked queue instead of a raw volume feed. Pairs naturally with alerting, since you only want to be paged on the top tier.
A relevance category is often the highest-value thing a team builds first. If your brand name is a common word, everything downstream (sentiment, volume trends, reporting) is wrong until you separate real mentions from coincidental ones.
Generic sentiment misreads framing, sarcasm, and comparison. A favorability category tuned to your brand and your industry's language gives you a number you can actually take to an executive.
Classify mentions by complaint type (shipping, product defect, billing, support experience) and route each segment to the team that owns it. This turns social listening into an operational input rather than a monthly report.
With Author Data enabled, build a category that separates journalists from customers from employees, then filter any other analysis by audience. How reporters talk about you and how buyers talk about you are different questions with different answers.
Classify whether a mention contains your campaign's core message. Trend it over the campaign window and you have a measurable answer to whether the message actually landed.
With Mention Image enabled, detect your logo in organic and partner content that never names you in text, invisible to keyword monitoring. See [Author and Image Smart Categories](/help/workflows/author-and-image-smart-categories).
Classify mentions by policy area or regulatory stage so public affairs teams can track the issues they own without reading everything.
***
## FAQs
Your category allowance is defined in your contract and varies by customer. The number next to the **Smart Categories** heading in Settings shows how many you currently have. To check your limit or discuss increasing it, contact your Customer Success Manager or [support@peakmetrics.com](mailto:support@peakmetrics.com).
Because the allowance is finite, it's worth retiring categories you've stopped using rather than letting them accumulate.
No. Each mention gets exactly one option per category. If you need overlapping classification, build separate categories and combine them as filters.
Yes. Categories are backfilled across existing workspace content as well as applied to new mentions going forward.
Yes. Select multiple workspaces when configuring it, useful for applying a consistent standard across brands, regions, or clients.
Classification is based on the datasets you enabled and the logic in your prompt. If a label looks wrong, check whether the relevant signal was actually available. A category reasoning about images will behave differently on a text-only mention.
Yes. If you'd like a backfill extesnion on your smart categories, send a message to your CX manager or email [support@peakmetrics.com](mailto:support@peakmetrics.com).
***
## Related reading
Step-by-step setup, prompt writing, and previewing.
A library of ready-to-deploy prompts across common use cases.
Classifying on visual content and author-level signals.
Smart Categories applied to how LLMs describe your brand.
**Questions?** Reach out to [support@peakmetrics.com](mailto:support@peakmetrics.com).
### Summaries, reports, and exports
Categories feed [AI-generated summaries](/help/building-reports/custom-ai-generated-summaries-in-peakmetrics), so filtering to a category and generating a summary gives you a narrative read of just that segment. Category values also export with your mentions for analysis elsewhere, see [Exporting Data](/help/workflows/exporting-data-from-peakmetrics-unlocking-powerful-insights).
***
## Example use cases
Severity tiers (`Critical`, `Elevated`, `Routine`) so crisis teams work a ranked queue instead of a raw volume feed. Pairs naturally with alerting, since you only want to be paged on the top tier.
A relevance category is often the highest-value thing a team builds first. If your brand name is a common word, everything downstream (sentiment, volume trends, reporting) is wrong until you separate real mentions from coincidental ones.
Generic sentiment misreads framing, sarcasm, and comparison. A favorability category tuned to your brand and your industry's language gives you a number you can actually take to an executive.
Classify mentions by complaint type (shipping, product defect, billing, support experience) and route each segment to the team that owns it. This turns social listening into an operational input rather than a monthly report.
With Author Data enabled, build a category that separates journalists from customers from employees, then filter any other analysis by audience. How reporters talk about you and how buyers talk about you are different questions with different answers.
Classify whether a mention contains your campaign's core message. Trend it over the campaign window and you have a measurable answer to whether the message actually landed.
With Mention Image enabled, detect your logo in organic and partner content that never names you in text, invisible to keyword monitoring. See [Author and Image Smart Categories](/help/workflows/author-and-image-smart-categories).
Classify mentions by policy area or regulatory stage so public affairs teams can track the issues they own without reading everything.
***
## FAQs
Your category allowance is defined in your contract and varies by customer. The number next to the **Smart Categories** heading in Settings shows how many you currently have. To check your limit or discuss increasing it, contact your Customer Success Manager or [support@peakmetrics.com](mailto:support@peakmetrics.com).
Because the allowance is finite, it's worth retiring categories you've stopped using rather than letting them accumulate.
No. Each mention gets exactly one option per category. If you need overlapping classification, build separate categories and combine them as filters.
Yes. Categories are backfilled across existing workspace content as well as applied to new mentions going forward.
Yes. Select multiple workspaces when configuring it, useful for applying a consistent standard across brands, regions, or clients.
Classification is based on the datasets you enabled and the logic in your prompt. If a label looks wrong, check whether the relevant signal was actually available. A category reasoning about images will behave differently on a text-only mention.
Yes. If you'd like a backfill extesnion on your smart categories, send a message to your CX manager or email [support@peakmetrics.com](mailto:support@peakmetrics.com).
***
## Related reading
Step-by-step setup, prompt writing, and previewing.
A library of ready-to-deploy prompts across common use cases.
Classifying on visual content and author-level signals.
Smart Categories applied to how LLMs describe your brand.
**Questions?** Reach out to [support@peakmetrics.com](mailto:support@peakmetrics.com).